In yesterday's post, I wrote that the USPTO had granted more utility patents in 2010 than in any other year in history – 31% more than in 2009. The ramp-up is not due to increased hiring of examiners. (The USPTO was in the midst of a hiring freeze for much of 2010). Likewise, the ramp-up is not explained by increased patent application filings. (Although there has been a small increase in filings, the large backlog buffers the output rate from input fluctuations). I suspect that the ramp-up is largely due to changes implemented by USPTO director David Kappos and Patent Commissioner Robert Stoll after the departure of former PTO Director John Dudas and Interim Director John Doll. The former regime focused on the PTO's role of denying "bad" patents from issuance. The new regime has modified that approach and instead looks to issue right-sized patents.
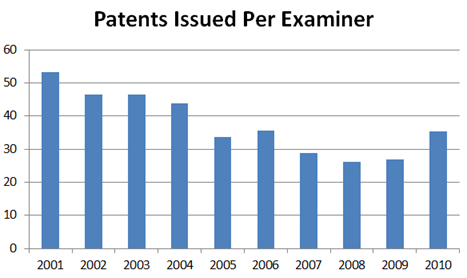
Although 2010 saw more issued patents than ever before in-history, the chart below provides some evidence that the rise in patent grants is not an historical anomaly. The chart shows the number of patents issued per examiner over the course of the past decade. The chart suggests that the 2010 rise is more of a return to the grant rates of the first-half of the past decade. The anomaly – at least from this perspective – is the 2007-2009 period where the grant rate dropped so precipitously.
David Kappos seems to be outdoing himself. Obviously, he can take a fair share of the credit for this upswing. By all accounts, the new Director of the US patent office appears to have earned his stellar reputation.
Neither, clearly, do you read your posts.
Cause if you read your posts, you would not post your posts.
Welcome back schooled boy. Now how abouts you wander over to the other threads that be waiten fro your answers. Chop chop.
And if anyone was looking for the poster known as Willton, he is gleefully posting anti-patent rhetoric at this site. For some reason, I think he has found his home.
You clearly did not read my posts.
OOhh – lookie – some quick windmills.
Some crxp that the PTO issued today (took five minutes to find):
7,871,077
1. Poker dice, comprising a set of six-sided poker dice wherein all 54 cards of a standard playing deck are represented on the set of six-sided poker dice and value markings and suit markings of all of the 54 cards of the standard playing deck are arranged on the poker dice wherein on any given roll the six-sided dice may produce any of the common poker hands including hands chosen from the set of all four of a kind and all straight flushes.
Allowed after an Interview which is summarized in the prosecution history in the most vague and pithy way imaginable.
—————–
7,872,235
1. A non-transitory tangible medium comprising
at least one radiopharmaceutical identity;
SPECT measured values of at least one radiopharmaceutical kinetic parameter of a flow rate across a tissue membrane, for the radiopharmaceutical, and
a set of instructions for associating the at least one radiopharmaceutical kinetic parameter with a disease signature.
Unbelievable.
—————-
7,873,996
9. A method for classifying a first message, comprising:
determining a sender, wherein the sender is associated with a second message, wherein the second message is in an inbox;
analyzing content of the second message;
updating a history, wherein the history is associated with the sender;
receiving the first message, wherein the first message is associated with the sender;
determining that the sender is associated with the second message;
retrieving information relating to a number of non-spam messages received from the sender from the history; and
determining a classification for the first message, wherein determining the classification includes evaluating the information relating to the number of non-spam messages received from the sender.
LOL.
An interesting comparison would be the number of final abandonments (ie ex RCEs) per examiner over time. I’ll be that shows a similar trend.
From the I-told-you-so department:
link to techdirt.com
Title is “US Patent Office Grants Massively More Patents Than Ever Before” with byline of “from the this-is-not-good dept“.
and includes:
“Patently-O put together this lovely chart to demonstrate the pattern”
And if anyone was looking for the poster known as Willton, he is gleefully posting anti-patent rhetoric at this site. For some reason, I think he has found his home.
Because the USPTO and the USDA are soooo much in common.
Yes, now accepting the non-sequitur of the day award…
Malcolm Sunshine.
“Quality does not equal rejections”
I wonder what would happen if the USDA applied this same philosophy to hamburger meat.
blah blah blah “Bilski” blah blah blah
And that be even with me agreein with the no-publish position.
Now here is a real cause for concern:
link to jsonline.com
The speaker (Michel) should be immediately identifiable as someone with authority to speak on this true theft of America’s assets.
Reform should include taking back this publication without due payment to the inventor.
And yes – !!! Bilski 14 !!!
Let me be more specific. If a Pro se is called by an examiner I imagine that would be allowed. But when you think you are Pro se (and are led to believe by the Examiner that you are Pro se “but aren’t,”} that calls for immediate dismissal, NO?
I’d also say that the trend simply looks like the result of the hiring freeze. When you’re not hiring new people for a year the collective experience of the examining corps grows. This means the average production per examiner goes up as does the average number of allowances.
“JNG it is against PTO policy for an examiner to call an Applicant… so they claim.”
-Sarah McPherson
No, sorry but this is not at all true.
this is an interesting piece of statistics. Now I’d be interested in the number of “really final” rejections per examiner (or patents filed and irrecoverably not survived examination / disposed off without grant).
They get fired. Who called you?
JNG it is against PTO policy for an examiner to call an Applicant… so they claim.
The article now has it right. The PTO was “stopped” by not being inclined to issue any patent that “looked bad”, by the impending Bilski decision and by other things. The Office is now returning to making more reasonable rejections. Don’t forget that a hiring freeze has many effects, some of which prevent the issuance of valid patents.
Speaking from my experience in the 705 art class I can say that something happened last year to the Examining Corp that I had not seen in a long time: they would call and discuss the case in person and explore where there might be common ground, instead of rejecting everything out of hand – no matter how far fetched the argument. That means that there was finally some movement in cases that had pending for 7 – 8 years. Some of these cases were on their SECOND appeal b/c the prior Examiners would play games with the rules/rejections. I suspect the willingness to talk to Applicants and look for allowable subject matter (instead of “inventing” reasons to reject) is largely responsible for a lot of this increase.
“I note in passing that last year’s rate of issued patents per examiner is quite comparable to the first couple years of Dudas’ reign, the second of which was also the previous record for total issued patents in a single year.”
If for no other reason it is IANAE that notes this, it is now abundantly clear that “issued patents per examiner” by itself simply is not telling the full story.
We need the rest of the story. We need the story on rejections, on rejections per examiner, on rejections as percent of actions, on the infamous rejections equals quality curve, as expressly declared by top brass under Dudas.
If only someone had pointed out to the patent bar some years ago that quality does not equal allowances.
I note in passing that last year’s rate of issued patents per examiner is quite comparable to the first couple years of Dudas’ reign, the second of which was also the previous record for total issued patents in a single year.
“we still have people speculating that it has to do with Kappos”
Can you try to approach some semblance of rationality?
Or did you miss one of the very first directives from Dave Kappos to all examiners:
“Quality does not equal rejections”
“right-sized patents” — can’t find that term in Title 35
So let’s get this straight, I come in a few years ago and say that allowances will be the order of the day on account of $ $ bills yo, and a side dish of examiners getting more experienced while new hiring will be curtailed.
And then a couple of years later, after my prediction became magically true, we still have people speculating that it has to do with Kappos (who most examiners have no interaction with what so ever).
I swear to go d. Incompetence runs deep in you people. If Kappos is to be blessed at all, it is as yet another side dish.
plurality – ya missed the message.
Having a thought of anything should be anything is not proper.
Just an observation – things should be looked at on the merits of that particular thing.
And yeah, I havta acknowledge that you do have a point about the maximizing claim scope for clients thought -it’s a good one so me dial back the smack on you for that. Kudos, as they say.
Ping, a belief that applications generally should be allowable on first action is a sign of a bad practitioner. It means that you draft your independent claims too narrowly and don’t really test the full breadth of scope that the inventor might be entitled to. The fact that most applications are not ready for allowance at first action is a sign that most practitioners are at least attempting to maximize claim scope on behalf of their clients.
Comin from the master O straw, that be one fine compliment.
there appears to be a correlation between Office controlled factors and the build up of the mountain of backlog. Heavens no, but it appears that the applicants are not to blame for this mess after all.
Nice strawman, pingaling. One of your finest.
What is a right-sized patent?
Sound like gobbly-gook to me.
“The anomaly – at least from this perspective – is the 2007-2009 period where the grant rate dropped so precipitously. ”
Hmmm – this sounds suspiciously like one O my observations.
Disbelievers take note – answers be highly overrated. Allz ya need are my observations and a little thinkin.
“This statistic would therefore be more useful if it separated out newer examiners as outliers.” – Lolz – as nearly half the examiners are new, this would really paint a different topic. And Iza think that your “ery few applications are allowable with no amendments at all” statement stems from the reject-reject-reject training you done got there plurality. Such a blanket statement smacks O the view of you-must-always-find-something-to-reject-on-the-first-time protocol.
What is a cause of concern is that there appears to be a correlation between Office controlled factors and the build up of the mountain of backlog. Heavens no, but it appears that the applicants are not to blame for this mess after all.
Those that be otch here are gonna be stunned at this result.
Oh, and Big D – Iza still be waitin for that graph of record rejections.
It should be noted that the hiring of new examiners will have a negative effect on the “patents issued per examiner” statistic. New examiners rarely get the opportunity to allow applications. This is mostly because they are working on first actions, and very few applications are allowable with no amendments at all. This statistic would therefore be more useful if it separated out newer examiners as outliers. For example, one might try considering issued patents where only a primary examiner is listed.