by Dennis Crouch
In February 2026, I published a study tracking the patent allowance rate by filing-date cohort, following every published utility application from filing to final resolution. See Dennis Crouch, The 20-Year Allowance Rate Arc, Patently-O (Feb. 27, 2026). That approach answer backward-looking question: of all the applications filed in a given month, what share ultimately became patents. It is the right metric for understanding how the patent system treats a generation of filings, but it carries an inherent delay. An application filed in 2020 does not resolve for two to four years, meaning the cohort data tells us about examination culture circa 2022-2024, not about what the agency is doing right now.
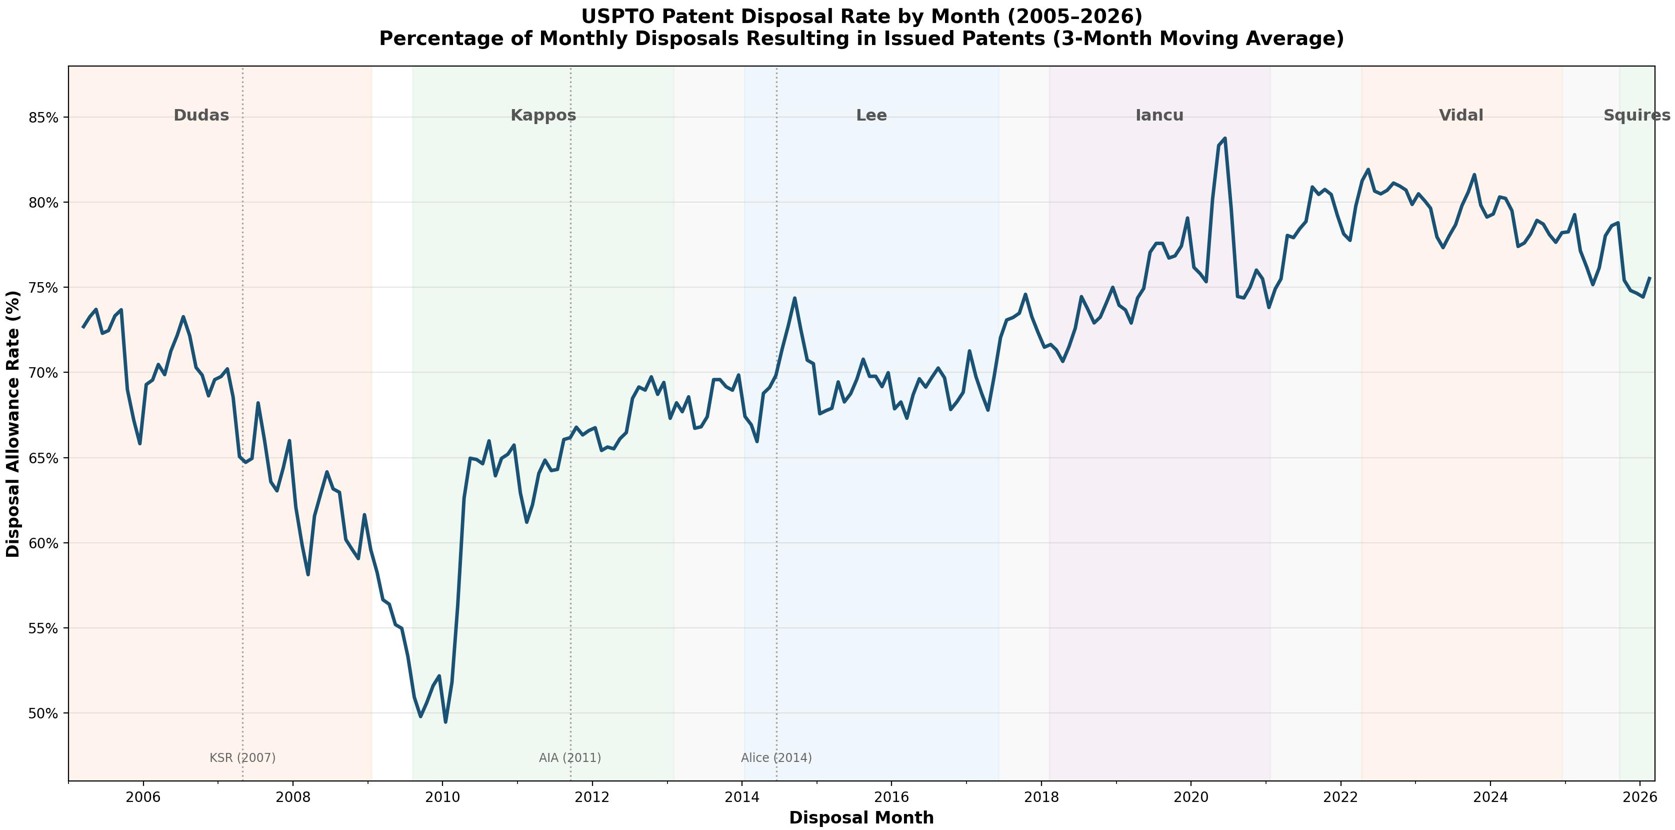
Today I want to offer a complementary view. Instead of grouping applications by when they were filed, the chart below groups them by when they were resolved. Each data point represents the percentage of applications disposed of in a given month (either issued as patents or abandoned) that resulted in issued patents. I call this the "disposal allowance rate," and it functions as a more immediate signal of the agency's examination posture.