by Dennis Crouch
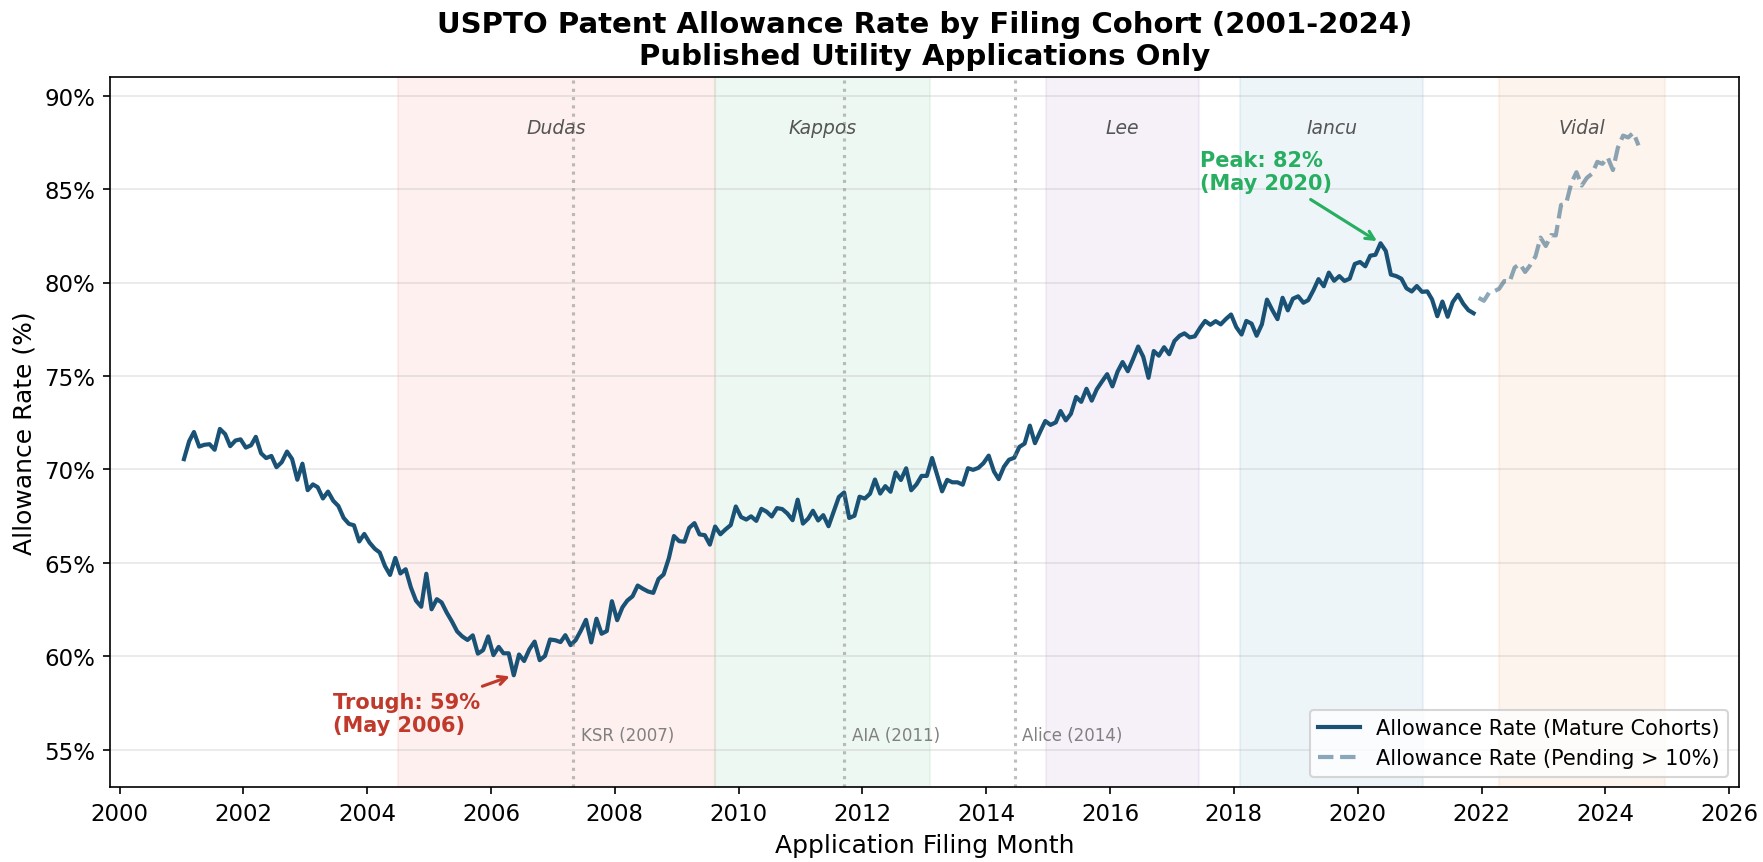
Every patent application eventually resolves into one of two outcomes: it issues as a patent or it is abandoned. I have been tracking those outcomes (along with those applications "still pending") for every published utility application filed at the USPTO over the past two decades - and see some striking patterns. The patent allowance rate, measured as the percentage of resolved applications that issued as patents, traces a deep V-curve across two decades. Applications filed in 2001 had an allowance rate of about 71%. That figure dropped steadily to a trough of 59% for applications filed in May 2006. It then reversed course and climbed, year after year, through 67% in 2010, 74% in 2015, and up to 82% for those filed in early 2020. That is a 23-percentage-point swing from trough to peak.
The first chart below plots the allowance rate by filing month for all published U.S. utility patent applications filed between January 2001 and July 2024. The allowance rate is calculated as the number of applications that issued as patents divided by the number that have been resolved (issued plus abandoned), excluding applications that remain pending. For cohorts filed before late 2021, fewer than 10% of applications remain pending, making the data highly reliable. For more recent filing months, the dashed line reflects preliminary data that will almost certainly shift (downward) as the remaining applications resolve.