The chart below tells a twenty-year story about how fee structure shapes patent scope. In 2005, the distribution of claims per U.S. utility patent looked roughly like what you might expect: a broad spread, peaking somewhere around 8-14 claims, with a long tail extending past 50. The 20-claim mark was visible, but a bump. Only 6% of patents issued with exactly 20 claims that year. By 2025, the picture has changed beyond recognition. A full 28% of utility patents now issue with exactly 20 claims. That bar dominates the histogram (especially once I colored it red).
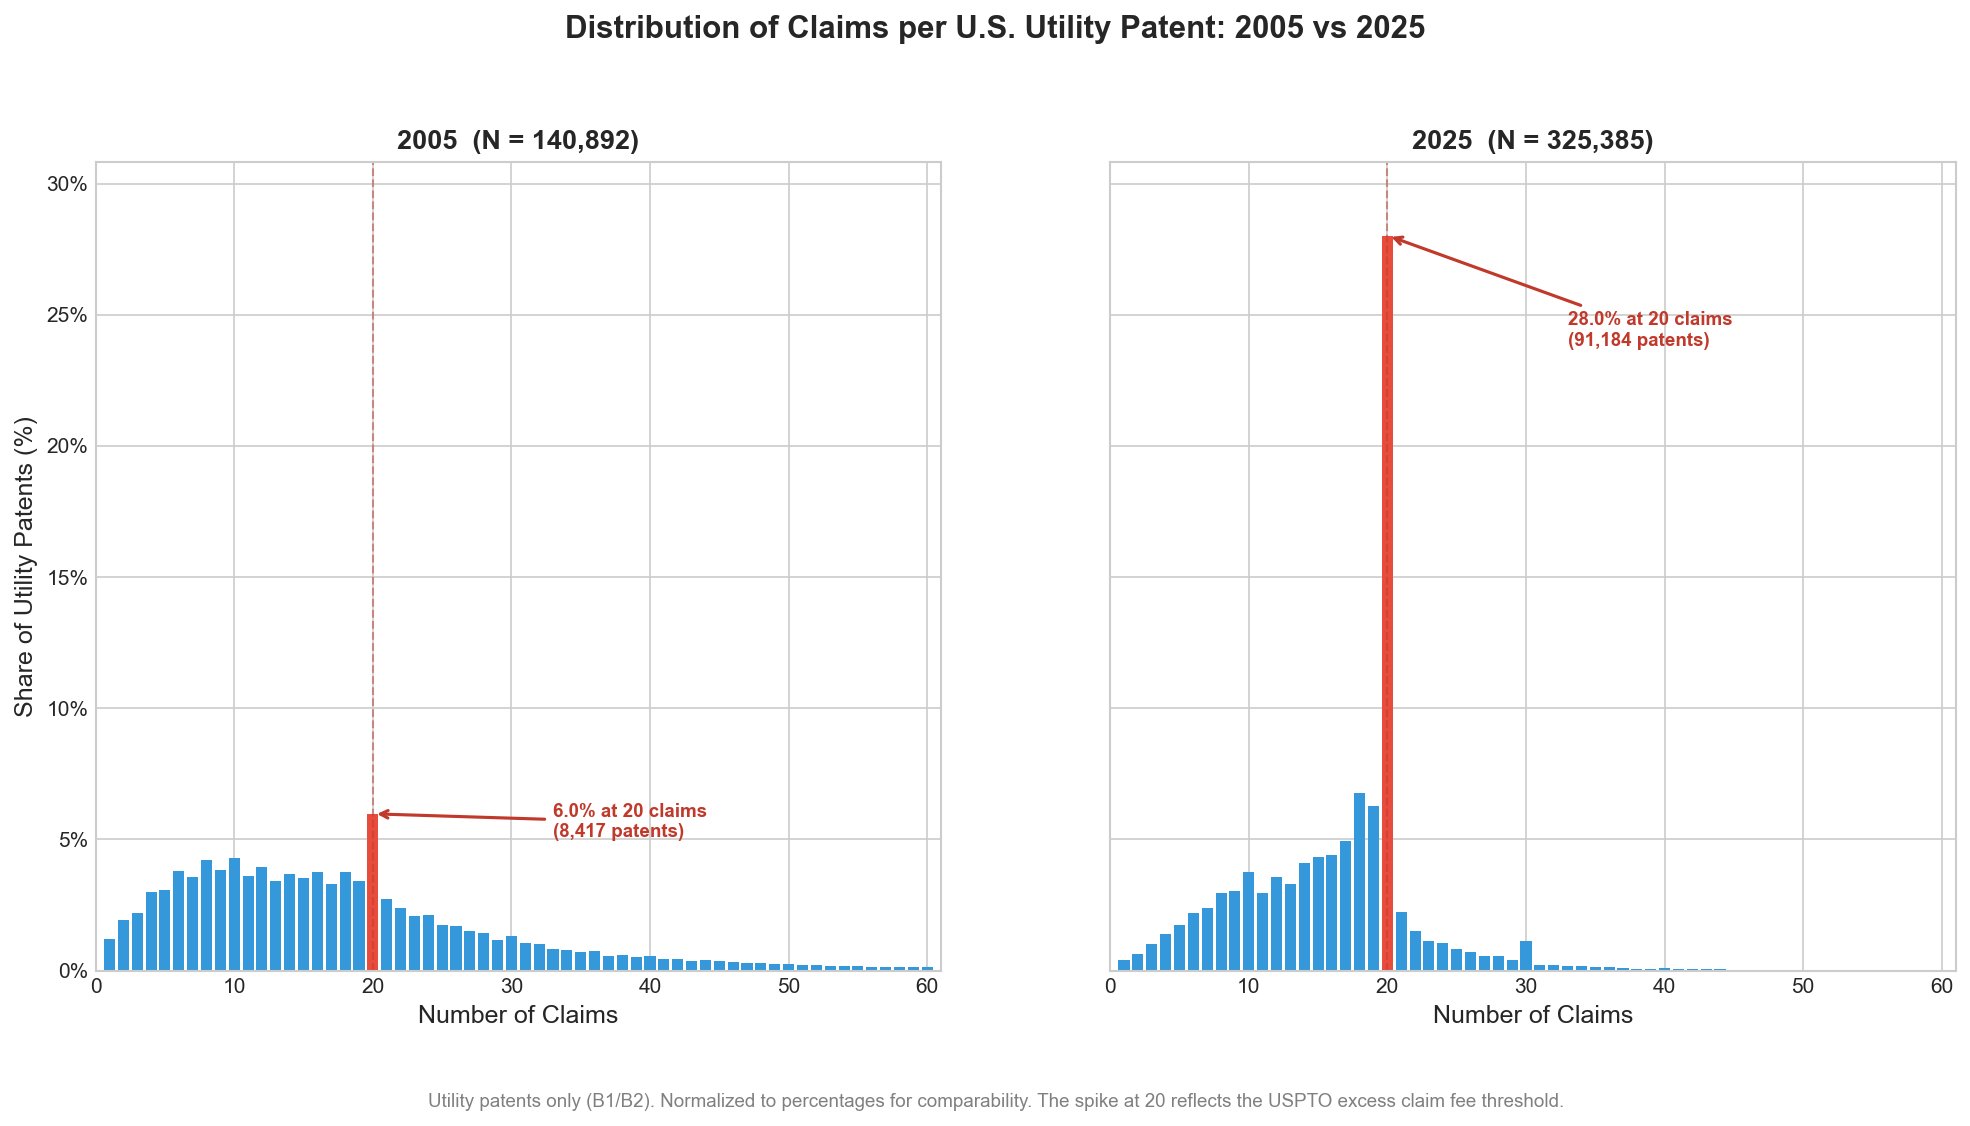
The cause is no mystery. Section 41(a)(1) of the Patent Act authorizes the USPTO to charge fees for each claim in excess of 20. Those fees have risen dramatically over the year and in January 2025 the USPTO doubled them from $100 to $200 per excess claim for large entities ($80 for small entities, $40 for micro entities). The fee for each independent claim beyond three also increased, from $480 to $600. The result is a system where the 20-claim threshold is beginning to function as a fairly hard wall. Patent applicants and their attorneys have responded rationally: they draft to the threshold and stop.